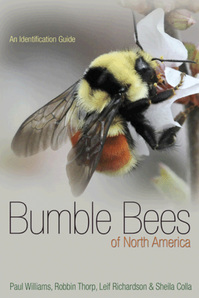
Bumble Bees of North America
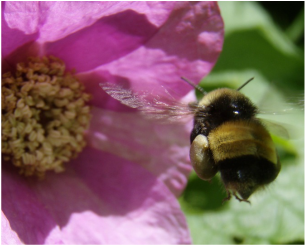
Relative to other insects, bumble bees are large, colorful, and familiar to many people. That said, they can be very difficult to identify. And despite their importance to human agriculture and ecosystem function, until recently we lacked effective tools for reliable identification of North American species. I have been interested in developing identification tools to address this need. In 2011, with co-authors Paul Williams and Sheila Colla, I produced a field guide, Bumble Bees of the Eastern United States, for the U.S. Forest Service and the Pollinator Partnership. The same authors, with Robbin Thorp, expanded on this concept with Bumble Bees of North America: an Identification Guide, published in 2014 by Princeton University Press. (photo: Bombus terricola worker foraging at Rubus odoratus.)
|
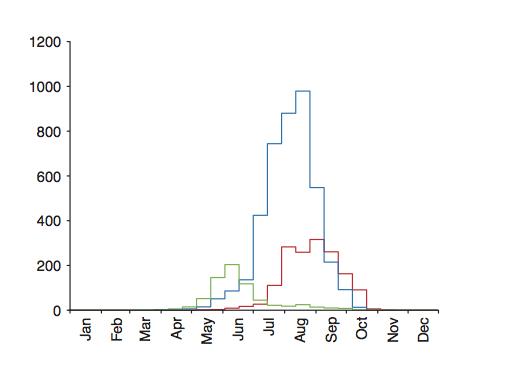
Part taxonomic revision and part field guide, this work provides the first comprehensive treatment of the ~50 species of Bombus found north of Mexico. We have updated taxonomy based on recent molecular phylogenetic work. With the help of more than 70 people and institutions who provided bee specimen data, we developed a database of ~275,000 bumble bee specimen records from 150 academic, research and private invertebrate zoology collections to support the project, and draw information from this on host plant associations, seasonal activity patterns, distribution, and conservation needs for each species. In this example (below right), the seasonal activity of Bombus vagans queens (green), workers (blue), and males (red) is estimated from museum specimen record data for the species from across its range.
Since publication of Bumble Bees of North America, we have continued to expand the database, which contains more than 600,000 records as of October, 2019. A list of contributors to the project may be found here. |
|
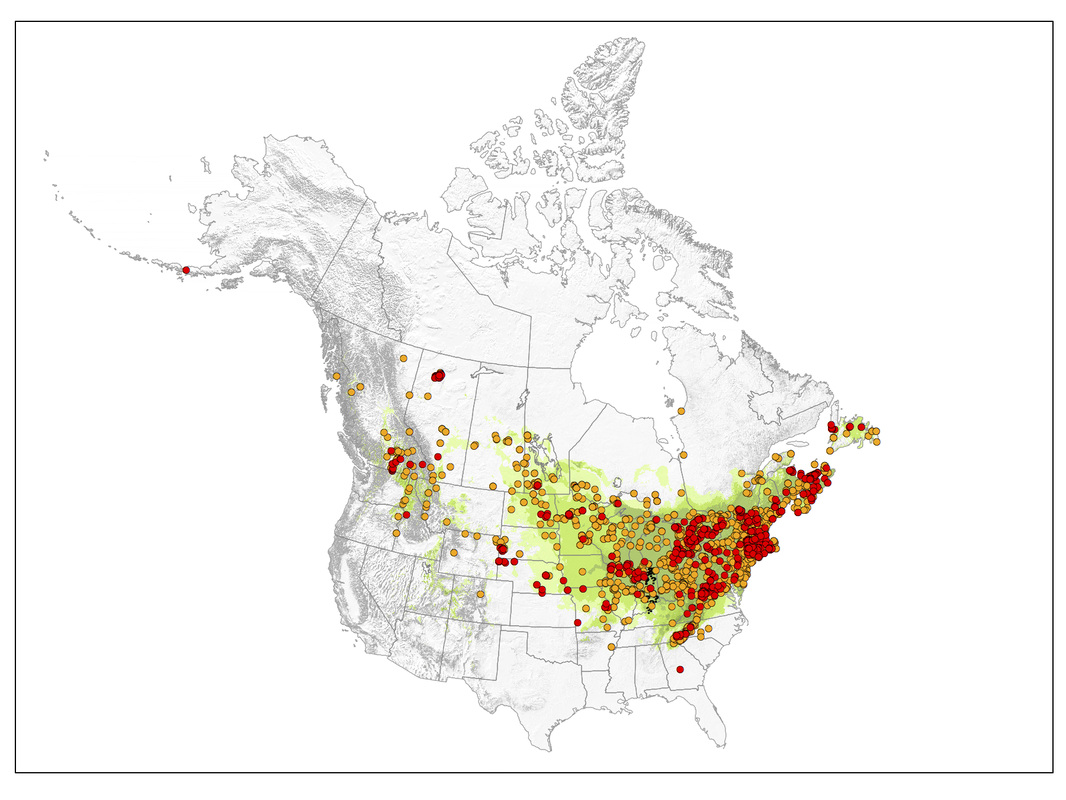
We used the maximum entropy method of MaxEnt to model species distributions, and provide maps of known and predicted areas of occurrence. We supplied MaxEnt software with known points of occurrence for each species and 18 climate models from Worldclim. In this example, orange dots represent historical (to 1995) collections of Bombus vagans, red dots are modern collections (1996-2012) and the green surface is the model of predicted distribution for the species.
Learn more about the database of bee records we built to create these maps and phenology plots here. |
|
|
|
Bumble Bees of North America: an Identification Guide is available through Princeton University Press, at Amazon.com and at bookstores.
|
